October 27 Stock Market: KOSPI Jumps 3.09% as CXL and Interconnect Lead the Rally
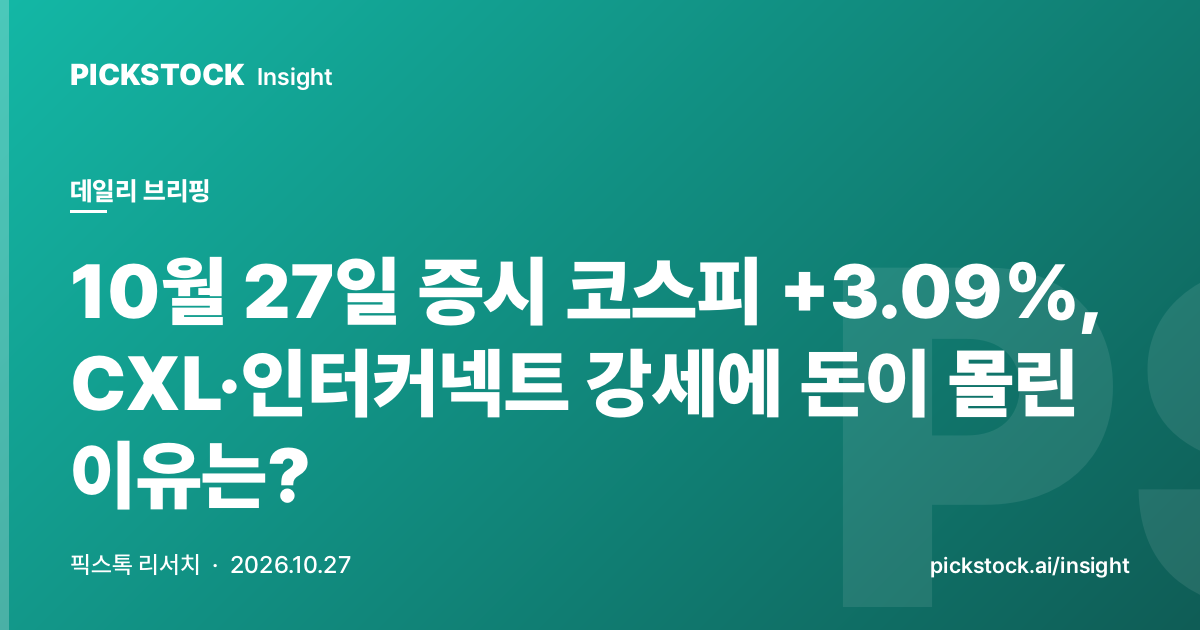
The Korean market closed higher on October 27, with KOSPI at 5,638.34 for a gain of 3.09%. Money clearly rotated toward CXL/interconnect names.
The Numbers First
KOSPI: 5,638.34 (+3.09%)
KOSDAQ: 743.83 (+2.29%)
Strong themes: CXL/interconnect, PCB, semiconductor substrates, photoresist
This summary covers the October 27 (2026-10-27) Korean market close, along with global macro indicators and strength across 100 investment themes. Use it as a starting point for the next session's opening.
Korean Market Close
| Index | Close | Change | Change % |
|---|---|---|---|
| KOSPI | 5,638.34 | 168.87 | +3.09% |
| KOSDAQ | 743.83 | 16.62 | +2.29% |
Global Macro Snapshot
| Indicator | Value | Daily Change |
|---|---|---|
| VIX (Fear Index) | 18.50 | - |
| US 10-Year Yield | 4.986% | - |
| Dollar Index (DXY) | 102.17 | - |
| USD/KRW | ₩1,326.75 | - |
| S&P 500 | 7,676.77 | - |
| Nasdaq | 26,169.38 | - |
| WTI Crude | $102.44 | - |
| Gold | $4,007.70 | - |
| Bitcoin | $79,725 | - |
Why Did CXL Stocks Lead?
CXL/interconnect ranked as the strongest theme.
Its average move was +8.64%, with 8 gainers and 0 decliners, a one-sided rally.
Top 3 Strong Themes
| Rank | Theme | Avg. Change | Up/Down | Leading Stock |
|---|---|---|---|---|
| 1 | CXL/Interconnect | +8.64% | 8/0 | Exicon (092870) +21.98% |
| 2 | PCB, Semiconductor Substrate | +8.48% | 9/0 | Korea Circuit (007810) +13.40% |
| 3 | Photoresist | +6.44% | 4/0 | Samyang NCChem (482630) +11.83% |
Which Themes Lagged?
CMO/CDMO contract manufacturing, solar/wind, and pet economy were the weakest themes.
Bottom 3 Weak Themes
| Rank | Theme | Avg. Change | Up/Down | Leading Decliner |
|---|---|---|---|---|
| 1 | CMO/CDMO Contract Manufacturing | -4.39% | 0/4 | SK Biopharm... Estpharm (237690) -9.15% |
| 2 | Solar/Wind | -2.55% | 1/6 | HD Hyundai Energy Solutions (322000) -12.46% |
| 3 | Pet Economy | -2.50% | 1/1 | OSP (368970) -5.82% |
How to Read the Next Session
The top 3 themes averaged +7.85%, so the direction of money is clear.
The bottom 3 themes averaged -3.15%, with selling concentrated in the weak sectors.
A single session is not enough to base trading decisions on.
Do not make trading decisions on single-day data. Judge by the combination of trends over five or more sessions and macro shifts.
Explore More
- Weekly reports and insights: PickStock Insight
- How to use macro indicators: Three Indicators That Measure the Market's Temperature
- Theme-linked stock map: PickStock Theme Explorer
Report date: 2026-10-27. Data sources: Naver Finance, Yahoo Finance, CNN Fear & Greed. Generated after checking price anomalies and the reference date. This is for information only and is not investment advice or a recommendation.
관련 테마의 대표 기업을 확인하고, 내 관심 종목은 뉴스·시그널·시장 맥락으로 이어서 볼 수 있습니다.
종목명을 입력하면 재무, 뉴스, 시장 데이터를 정보 제공용 점검 리포트로 정리합니다.
관심 테마로 저장하면 마이페이지에서 다시 볼 수 있고, 강한 움직임이 생길 때 주간 테마 시그널과 연결해 확인할 수 있습니다.
Keep reading