KOSPI Jumps 6.63% as Cloud Computing Leads: Why Did It Rally So Hard?
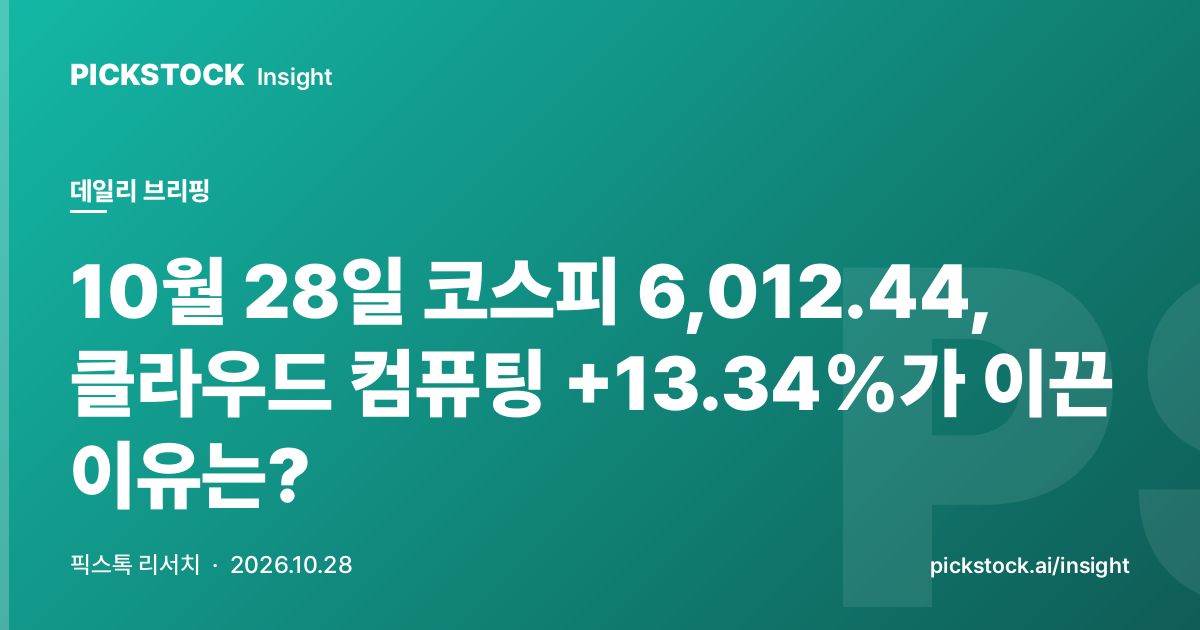
KOSPI jumped 6.63% to close at 6,012.44 on October 28. The bigger story is where the money went, not the index itself.
KOSDAQ closed at 771.28, up 3.69%.
Cloud computing, quantum computing, and HBM memory drew the strongest flows.
The Numbers First
- KOSPI 6,012.44 (+6.63%)
- KOSDAQ 771.28 (+3.69%)
- Strongest themes today: Cloud Computing, Quantum Computing, HBM Memory
This report covers the Korean market close on 2026-10-28, along with global macro indicators and the strength of 100 investment themes.
Use it as a starting point for gauging the next session's opening.
Korean Market Close
| Index | Close | Change | Change % |
|---|---|---|---|
| KOSPI | 6,012.44 | 374.10 | +6.63% |
| KOSDAQ | 771.28 | 27.45 | +3.69% |
Global Macro Snapshot
| Indicator | Value | Daily Change |
|---|---|---|
| VIX (Fear Index) | 17.57 | - |
| US 10-Year Yield | 4.993% | - |
| Dollar Index (DXY) | 102.38 | - |
| USD/KRW | ₩1,338.08 | - |
| S&P 500 | 7,722.60 | - |
| Nasdaq | 26,477.81 | - |
| WTI Crude | $101.50 | - |
| Gold | $4,069.10 | - |
| Bitcoin | $81,361 | - |
Where the Money Flowed
| Rank | Theme | Avg Change | Up/Down | Leading Stock |
|---|---|---|---|---|
| 1 | Cloud Computing | +13.34% | 5/0 | KINX (093320) +29.96% |
| 2 | Quantum Computing | +11.19% | 3/0 | ICTK (456010) +16.76% |
| 3 | HBM Memory | +9.73% | 8/0 | DI (003160) +14.55% |
Where the Money Left
| Rank | Theme | Avg Change | Up/Down | Weakest Stock |
|---|---|---|---|---|
| 1 | Metaverse/XR | -4.71% | 1/2 | K3I (431190) -10.68% |
| 2 | Petconomy | -1.25% | 0/1 | OSP (368970) -2.51% |
| 3 | Biosimilars | -1.22% | 6/1 | Prestige Biopharma (950210) -16.44% |
Will Cloud Computing Stocks Keep Running?
The top three themes averaged +11.42%.
The direction of money is clear.
Splitting entries rather than chasing looks like the more measured approach.
Do not make trading decisions on a single session. Judge with trends over five or more trading days alongside macro changes.
What to Confirm Next Session
Whether next session's trading value and flows confirm this move is the thing to watch.
Dig Deeper
- Weekly reports and insights: PickStock Insight
- How to read macro indicators: Three Indicators to Gauge the Market's Temperature
- Theme-linked stock map: PickStock Theme Explorer
Report base date: 2026-10-28. Data sources: Naver Finance, Yahoo Finance, CNN Fear & Greed. Generated after checking price anomalies and the base date. This is for information only, not investment advice or solicitation.
관련 테마의 대표 기업을 확인하고, 내 관심 종목은 뉴스·시그널·시장 맥락으로 이어서 볼 수 있습니다.
종목명을 입력하면 재무, 뉴스, 시장 데이터를 정보 제공용 점검 리포트로 정리합니다.
관심 테마로 저장하면 마이페이지에서 다시 볼 수 있고, 강한 움직임이 생길 때 주간 테마 시그널과 연결해 확인할 수 있습니다.
Keep reading