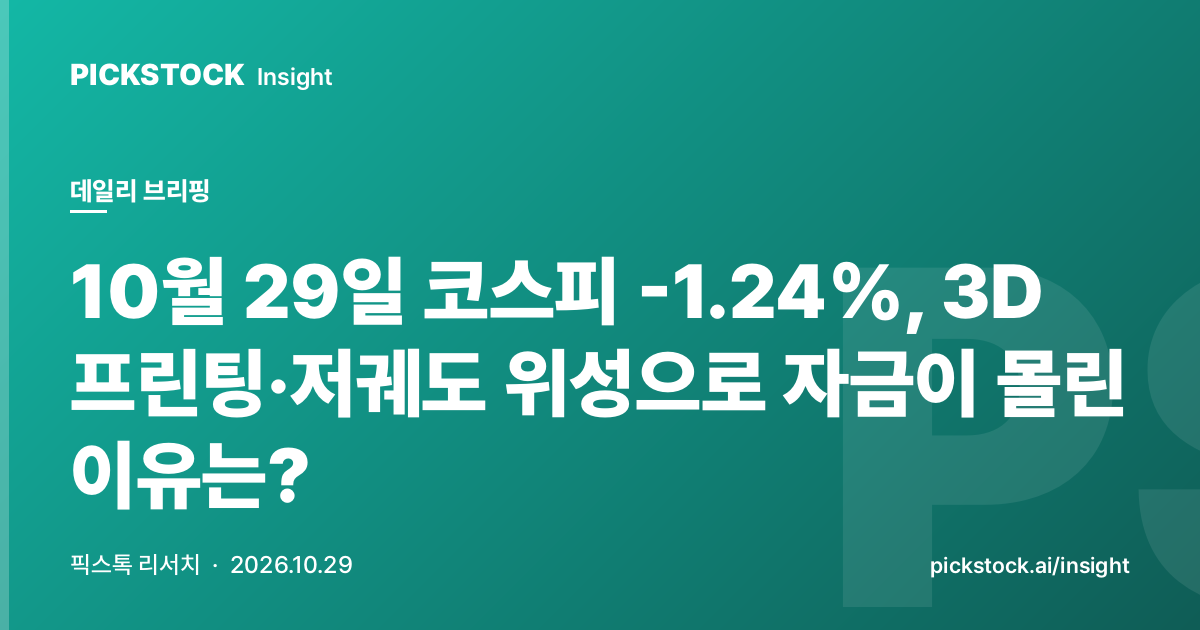
KOSPI Falls 1.24% on Oct 29, Why Money Flowed Into 3D Printing and Low-Orbit Satellites
The Numbers First
KOSPI closed at 5,937.66 on October 29.
The KOSPI move matters less than where the money went.
- KOSPI 5,937.66 (-1.24%)
- KOSDAQ 753.23 (-2.34%)
- Strongest themes today: 3D printing, low-orbit satellites, banks
This session (2026-10-29) brings together the Korean market close, global macro indicators, and strength across 100 investment themes.
Use it as a starting point for gauging the next session's opening.
Where Did the KOSPI Slide Hit?
| Index | Close | Change | Change % |
|---|---|---|---|
| KOSPI | 5,937.66 | -74.78 | -1.24% |
| KOSDAQ | 753.23 | -18.05 | -2.34% |
Global Macro Snapshot
| Indicator | Value | Daily Change |
|---|---|---|
| VIX (Fear Index) | 17.27 | - |
| US 10-Year Yield | 5.045% | - |
| Dollar Index (DXY) | 102.27 | - |
| USD/KRW | ₩1,336.38 | - |
| S&P 500 | 7,743.98 | - |
| Nasdaq | 26,549.85 | - |
| WTI Crude | $101.70 | - |
| Gold | $4,033.40 | - |
| Bitcoin | $79,946 | - |
Where Were 3D Printing Stocks Strongest?
| Rank | Theme | Avg. Change | Up/Down | Lead Gainer |
|---|---|---|---|---|
| 1 | 3D Printing | +3.85% | 1/2 | Rokit Healthcare (376900) +21.79% |
| 2 | Low-Orbit Satellite | +2.75% | 4/2 | Kontech (451760) +8.79% |
| 3 | Banks | +1.88% | 8/1 | JB Financial Group (175330) +4.50% |
Which Themes Lagged?
| Rank | Theme | Avg. Change | Up/Down | Lead Decliner |
|---|---|---|---|---|
| 1 | SMR (Small Modular Reactor) | -8.45% | 0/5 | Daewoo E&C (047040) -18.57% |
| 2 | UAM/Drone | -6.71% | 0/4 | Duksan Neolux (266690) -11.11% |
| 3 | Metaverse/XR | -6.46% | 0/3 | K3i (431190) -7.72% |
What to Confirm Next Session
Both markets sold off together (KOSPI -1.24%, KOSDAQ -2.34%).
It is worth checking for a macro shock.
The strength of the next session's rebound will mark the turning point for the trend.
The BOTTOM 3 themes averaged -7.21%.
Selling concentrated in the weakest themes.
A short-term rebound from oversold levels is possible, but calling a trend reversal is premature.
Do not make trading decisions on a single session's data. Judge by combining 5+ session trends with macro changes.
Dig Deeper
- Weekly reports and insights: PickStock Insight
- How to use macro indicators: Three Indicators That Measure the Market's Temperature
- Theme-linked stock map: PickStock Theme Explorer
Report date: 2026-10-29. Data sources: Naver Finance, Yahoo Finance, CNN Fear & Greed. Generated after checking price anomalies and the reference date. This is for information only and not investment advice or a recommendation.
관련 테마의 대표 기업을 확인하고, 내 관심 종목은 뉴스·시그널·시장 맥락으로 이어서 볼 수 있습니다.
종목명을 입력하면 재무, 뉴스, 시장 데이터를 정보 제공용 점검 리포트로 정리합니다.
관심 테마로 저장하면 마이페이지에서 다시 볼 수 있고, 강한 움직임이 생길 때 주간 테마 시그널과 연결해 확인할 수 있습니다.
Keep reading