KOSPI Closes at 5,683.80 as Solar/Wind Leads +11.27%: Why?
KOSPI rose 0.62% on November 4. The real story is where the money went.
The Numbers First
KOSPI: 5,683.80 (+0.62%)
KOSDAQ: 714.95 (+1.50%)
Strong themes: Solar/Wind, Solid-State Batteries, Esports
This summary covers the Korean market close on 2026-11-04, along with global macro indicators and the strength of 100 investment themes. It is a useful starting point for gauging the next session's opening.
Korean Market Close
| Index | Close | Change | Change % |
|---|---|---|---|
| KOSPI | 5,683.80 | 35.01 | +0.62% |
| KOSDAQ | 714.95 | 10.56 | +1.50% |
Global Macro Snapshot
| Indicator | Value | Daily Change |
|---|---|---|
| VIX (Fear Index) | 19.07 | - |
| US 10-Year Yield | 4.952% | - |
| Dollar Index (DXY) | 101.31 | - |
| USD/KRW | ₩1,340.25 | - |
| S&P 500 | 7,568.92 | - |
| Nasdaq | 25,372.01 | - |
| WTI Crude | $96.50 | - |
| Gold | $4,046.80 | - |
| Bitcoin | $78,382 | - |
Where the Money Went
| Rank | Theme | Avg Change | Up/Down | Leading Stock |
|---|---|---|---|---|
| 1 | Solar/Wind | +11.27% | 7/1 | Daemyung Energy (389260) +29.96% |
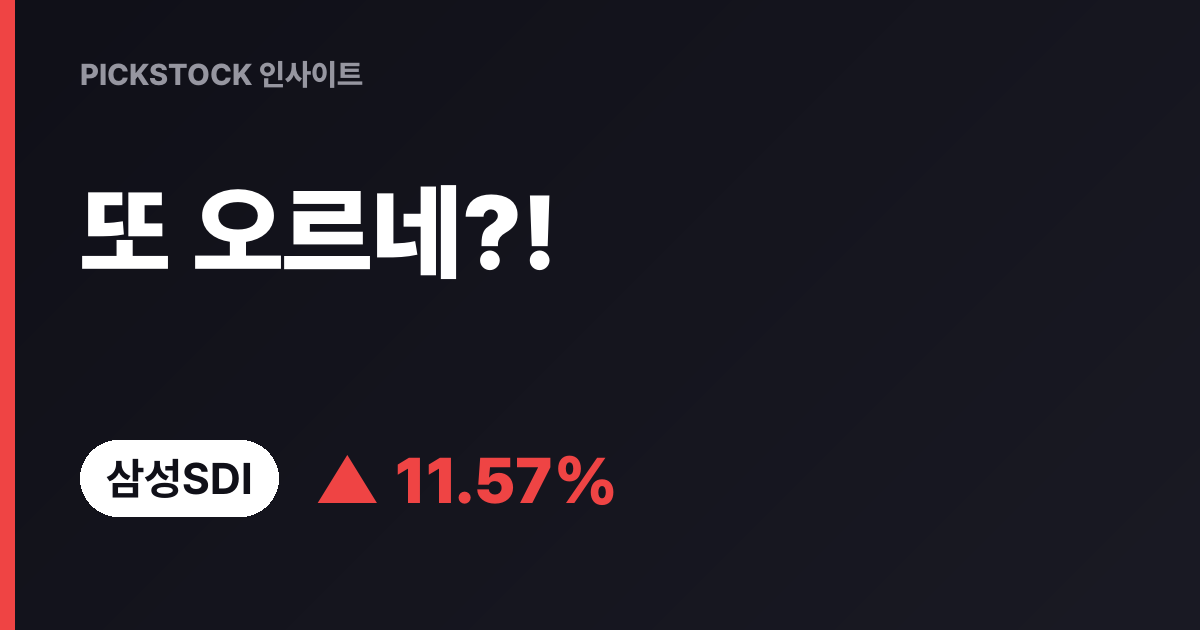
| 2 | Solid-State Battery | +9.86% | 3/0 | Samsung SDI (006400) +11.57% |
| 3 | Esports | +9.45% | 2/0 | Krafton (259960) +16.55% |
Which Themes Lost Ground?
| Rank | Theme | Avg Change | Up/Down | Leading Weak Stock |
|---|---|---|---|---|
| 1 | Cybersecurity | -6.22% | 1/16 | Genians (263860) -13.99% |
| 2 | Quantum Computing | -5.70% | 0/3 | ICTK (456010) -9.15% |
| 3 | K-Content/Entertainment | -3.57% | 1/8 | HYBE (352820) -11.48% |
Wind Stocks: Where Is the Strength Now?
The top three themes averaged +10.19%.
The money trail is clear.
The bottom three averaged -5.16%.
Selling pressure concentrated in the weakest themes.
Why Did KOSPI Jump? The Short Answer
Solar/wind was the center of this strength.
Average change of +11.27%, with 7 stocks rising.
Next, confirm whether trading value and flows carry this move into the next session.
Do not make trading decisions on a single session's data. Judge by the combination of trends over 5 or more sessions and macro changes.
Explore Further
- Weekly reports and insights: PickStock Insight
- How to use macro indicators: Three Indicators That Measure the Market's Temperature
- Theme-linked stock map: PickStock Theme Explorer
Report date: 2026-11-04. Data sources: Naver Finance, Yahoo Finance, CNN Fear & Greed. Generated after checking price anomalies and the reference date. For information only, not investment advice or recommendation.
관련 테마의 대표 기업을 확인하고, 내 관심 종목은 뉴스·시그널·시장 맥락으로 이어서 볼 수 있습니다.
종목명을 입력하면 재무, 뉴스, 시장 데이터를 정보 제공용 점검 리포트로 정리합니다.
관심 테마로 저장하면 마이페이지에서 다시 볼 수 있고, 강한 움직임이 생길 때 주간 테마 시그널과 연결해 확인할 수 있습니다.
Keep reading